How to Read Crypto Charts: Candlesticks, Volume, and Trends
Learn how to read candlesticks, timeframes, volume, support and resistance, and moving averages — and why no chart can predict the future.
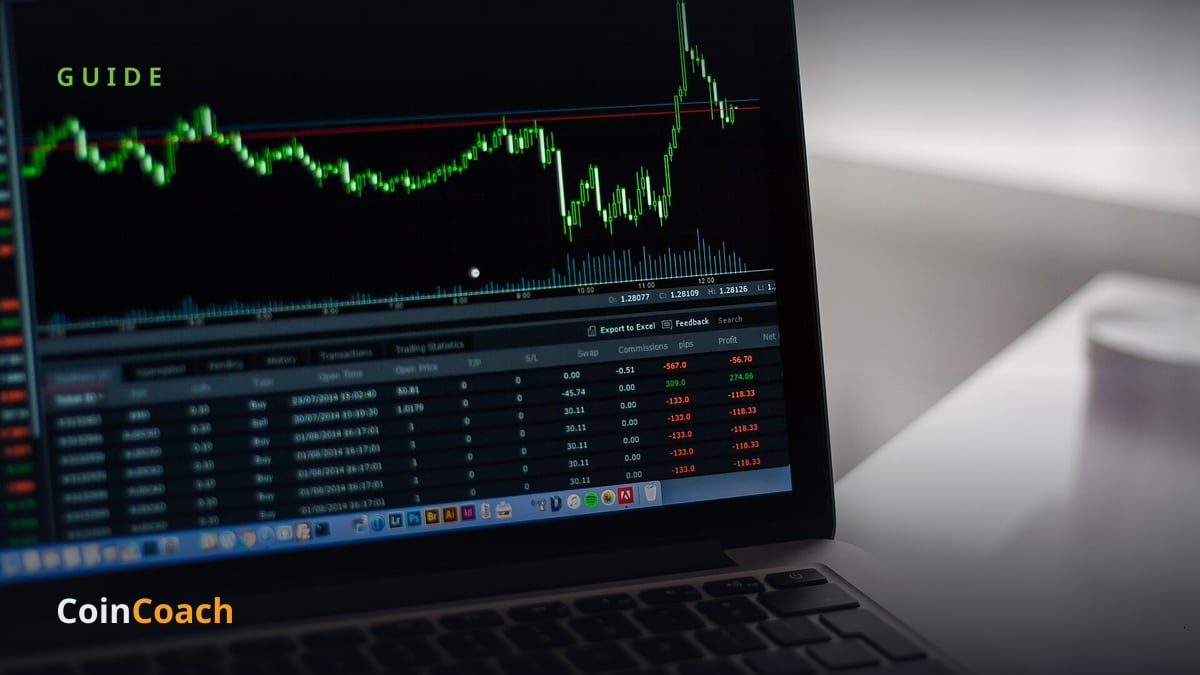
Photo: Negative Space, CC0, via Wikimedia Commons
Open any crypto app and the first thing you see is a wall of green and red bars marching across the screen. To a newcomer it looks like noise; to a chart reader it is a compressed history of every trade. This guide walks through the basic building blocks — candlesticks, timeframes, volume, support and resistance, and moving averages — and, just as importantly, what charts can't tell you.
The anatomy of a candlestick
A candlestick is a bar that summarizes price movement over one fixed window of time, using four numbers: the open (price when the window started), the high and low (the extremes reached), and the close (price when it ended). The thick rectangle is the body, which stretches between the open and the close. The thin lines poking out of the top and bottom are the wicks (also called shadows), marking the highest and lowest prices hit along the way.
Color tells you direction. A green (or white) candle means the close was higher than the open — buyers won that round. A red (or black) candle means the close was lower. A long body signals a decisive move; a tiny body with long wicks signals a tug-of-war where price traveled far but ended near where it started.
The technique is old: candlestick charting is generally credited to Honma Munehisa, an 18th-century Japanese rice trader at the Dojima Rice Exchange in Osaka, and it reached Western traders largely through Steve Nison's 1991 book on the subject.
Timeframes: same coin, different story
Every candle represents one timeframe — one minute, one hour, one day, one week. The same asset can look completely different depending on which you choose. A coin in a smooth multi-month uptrend on the weekly chart may look like a terrifying crash on the five-minute chart. Neither view is wrong; they answer different questions. One quirk of crypto: markets trade 24/7, so there is no official closing bell — most platforms simply cut daily candles at midnight UTC.
Volume: the move's lie detector
Volume is the total amount of an asset traded during a candle's window, usually drawn as bars under the chart. It measures conviction. A price surge on heavy volume means many participants pushed it there; the same surge on thin volume could be a handful of trades that reverse just as easily. When a big move comes with little volume behind it, experienced readers treat it with suspicion.
Support and resistance: zones, not magic lines
Support is a price area where buying interest has repeatedly shown up in the past; resistance is an area where selling has repeatedly capped advances. These are zones of remembered human behavior — people who bought near a level tend to defend it, and people who got stuck at a peak tend to sell when price returns there. They are not force fields. Levels break constantly, which is why honest analysts draw them as fuzzy zones rather than precise lines.
Moving averages: smoothing the noise
A moving average is simply the average closing price over the last N periods, redrawn each day as a smooth line — the 50-day and 200-day versions are the most watched. They strip out daily jitter so you can see the broader drift. The catch: they are built entirely from past prices, so they lag. By the time a moving average turns, the move that turned it has already happened.
A healthy dose of skepticism
Here is the part many chart tutorials skip. Technical analysis — the practice of forecasting prices from chart patterns — is probabilistic at best. Patterns fail routinely, and hindsight bias makes old charts look far more readable than live ones ever are: every crash looks "obvious" afterward. No candlestick formation predicts an exchange collapse, a regulatory announcement, or an ETF decision. The U.S. Securities and Exchange Commission has long warned that most people who attempt rapid, chart-driven day trading suffer severe financial losses.
How beginners actually benefit
Used modestly, charts are still genuinely useful. They let you spot how volatile an asset really is before you buy, recognize when price has already gone vertical — a classic moment to avoid a FOMO entry — and put today's headline move into months of context.
The bottom line
A chart is a record of the past, not a window into the future. Learn to read candlesticks, volume, and trends so the screen stops being intimidating — then stay humble about what they prove. This guide is for educational purposes only and is not financial advice.
Sources
CoinCoach publishes clear, trustworthy cryptocurrency and blockchain news, guides, token breakdowns, and reviews.
Related Stories

Bitcoin Halving Cycles: What History Shows and What It Doesn't

CBDCs vs. Crypto: What a Digital Dollar (or Loonie) Would Really Be